
Instrument MQTT based python messaging app using Open Telemetry
Some time back I did a bit of an intro to OpenTelemetry and in there I covered some basics like what Signals and Context Propagation are. I also spoke about how concepts like Tracing, Spans and Instrumentation interrelate to one another. I even put some code samples up at GitHub to demo this.
Most if not all of those code samples are in .NET and they demo tracing and baggage. Since I did that talk in 2021 the OpenTelemetry community have decided to add logs as a signal.
Logs Are a Signal
There are 4 types of signals as of the time of writing this.
- Tracing
- Metrics
- Baggage
- Logs
The Logs have the same specification as a span event we used to know before.
Instrumenting Python (and Paho MQTT Client)
I recently had to instrument an existing app written in python that uses MQTT protocol to communicate.
There were a few things I needed to do
- Instrument the python app(s) using OTEL Python SDK for Tracing, Metrics and Logs
- Figure out how context propagation works with the MQTT protocol (if the python MQTT client I used isn’t already instrumented. Spoiler, it wasn’t)
- Decide if
- I use specific exporters directly from the python app (No OTEL Collector) or
- Export to an OTEL Collector in OTLP format and then export it to specific tool from there. Spoiler. I chose the OTEL Collector approach.
- Deploy OTEL Collector to k8s/Docker Compose and configure it to export to my tools like Jaeger and Prometheus.
- Configuring OTEL Collector with exporters
- Configuring Prometheus to scrape from my OTEL collector
- Setting up Grafana to add Prometheus as a data source
- Setting up Azure Monitor Exporter
OTEL Python SDK
The OTEL official documentation is a good place to start. There are some examples of how to setup and use traces/metrics. If you need something more specific, there are more examples here.
For brevity let’s look at some simple code examples.
First, install these packages
pip install opentelemetry-api
pip install opentelemetry-sdk
pip install opentelemetry-exporter-otlp
Traces
from opentelemetry import trace
from opentelemetry.trace.propagation.tracecontext import TraceContextTextMapPropagator
from opentelemetry.trace import Status, StatusCode, SpanKind
from opentelemetry.sdk.resources import SERVICE_NAME, SERVICE_INSTANCE_ID, Resource
from opentelemetry.semconv.trace import SpanAttributes
from opentelemetry.sdk.trace import TracerProvider
from opentelemetry.sdk.trace.export import (
    BatchSpanProcessor,
    ConsoleSpanExporter,
)

from opentelemetry.exporter.otlp.proto.grpc.trace_exporter import OTLPSpanExporter

OTLP_endpoint = "http://127.0.0.1:4317"

def add_console_exporter(provider: TracerProvider):
    processor = BatchSpanProcessor(span_exporter=ConsoleSpanExporter(), schedule_delay_millis=1000)
    provider.add_span_processor(processor)

def add_otlp_exporter(provider: TracerProvider):
    otlp_exporter = OTLPSpanExporter(endpoint=OTLP_endpoint, insecure=True)
    otlp_span_processor = BatchSpanProcessor(span_exporter=otlp_exporter, schedule_delay_millis=1000)
    provider.add_span_processor(otlp_span_processor)

resource = Resource.create({SERVICE_NAME: "Service1", SERVICE_INSTANCE_ID: "1"})
provider = TracerProvider(
            # This can also be read from envrionment variables https://opentelemetry.io/docs/reference/specification/sdk-environment-variables/
            resource=resource
           )

# setup the exporters
add_console_exporter(provider)
add_otlp_exporter(provider)

# Sets the global default tracer provider
trace.set_tracer_provider(provider)

# Creates a tracer from the global tracer provider
tracer = trace.get_tracer("Service1")

# Use atrribute function decorator to indicate a new span
@tracer.start_as_current_span("Service1_Create_Message", kind=SpanKind.INTERNAL)
def some_function(msg):
    try:
        publish_message(msg)
    except Exception as ex:
        current_span = trace.get_current_span()
        current_span.set_status(Status(StatusCode.ERROR))
        current_span.record_exception(ex)
        raise
    publish_message(msg)

@tracer.start_as_current_span("Service1_Publish_Message", kind=SpanKind.CLIENT, attributes={SpanAttributes.MESSAGING_PROTOCOL: "MQTT"})
def publish_message(payload):
    # Do something here
    # Another way to start a new span is to call tracer.start_as_current_span
    tracer.start_as_current_span("publish_message", kind=SpanKind.PRODUCER):
    #     do the work here
Metrics
It’s the same pattern for metrics
from opentelemetry import metrics
from opentelemetry.sdk.metrics import MeterProvider
from opentelemetry.sdk.metrics.export import PeriodicExportingMetricReader, ConsoleMetricExporter

from opentelemetry.exporter.otlp.proto.grpc.metric_exporter import OTLPMetricExporter

OTLP_endpoint = "http://127.0.0.1:4317"

console_metric_reader = PeriodicExportingMetricReader(exporter=ConsoleMetricExporter(), export_interval_millis=1000)
otlp_metric_reader = PeriodicExportingMetricReader(exporter=OTLPMetricExporter(endpoint=OTLP_endpoint, insecure=True),
                                                   export_interval_millis=1000)
meter_provider = MeterProvider(resource=resource,
                               metric_readers=[console_metric_reader, otlp_metric_reader])
metrics.set_meter_provider(meter_provider=meter_provider)

# Create meter from global meter provider
meter = metrics.get_meter("Service1", "1.0")
counter = meter.create_counter("message_count", "messages", "number of messages")

def some_function():
  # increase the counter
  counter.add(1)
Logging
Example from https://github.com/open-telemetry/opentelemetry-python/blob/main/docs/examples/logs/example.py
  import logging

  from opentelemetry import trace
  from opentelemetry._logs import set_logger_provider
  from opentelemetry.exporter.otlp.proto.grpc._log_exporter import (
      OTLPLogExporter,
  )
  from opentelemetry.sdk._logs import LoggerProvider, LoggingHandler
  from opentelemetry.sdk._logs.export import BatchLogRecordProcessor
  from opentelemetry.sdk.resources import Resource
  from opentelemetry.sdk.trace import TracerProvider
  from opentelemetry.sdk.trace.export import (
      BatchSpanProcessor,
      ConsoleSpanExporter,
  )

  trace.set_tracer_provider(TracerProvider())
  trace.get_tracer_provider().add_span_processor(
      BatchSpanProcessor(ConsoleSpanExporter())
  )

  logger_provider = LoggerProvider(
      resource=Resource.create(
          {
              "service.name": "shoppingcart",
              "service.instance.id": "instance-12",
          }
      ),
  )
  set_logger_provider(logger_provider)

  exporter = OTLPLogExporter(insecure=True)
  logger_provider.add_log_record_processor(BatchLogRecordProcessor(exporter))
  handler = LoggingHandler(level=logging.NOTSET, logger_provider=logger_provider)

  # Attach OTLP handler to root logger
  logging.getLogger().addHandler(handler)

  # Log directly
  logging.info("Jackdaws love my big sphinx of quartz.")

  # Create different namespaced loggers
  logger1 = logging.getLogger("myapp.area1")
  logger2 = logging.getLogger("myapp.area2")

  logger1.debug("Quick zephyrs blow, vexing daft Jim.")
  logger1.info("How quickly daft jumping zebras vex.")
  logger2.warning("Jail zesty vixen who grabbed pay from quack.")
  logger2.error("The five boxing wizards jump quickly.")


  # Trace context correlation
  tracer = trace.get_tracer(__name__)
  with tracer.start_as_current_span("foo"):
      # Do something
      logger2.error("Hyderabad, we have a major problem.")

  logger_provider.shutdown()
If you’re looking to easily instrument a popular python library, the open telemetry python contrib repo is the one stop shop for most auto-instrumentation libraries.
For example, here is how you would instrument the requests package for http calls.
    import requests
    from opentelemetry.instrumentation.requests import RequestsInstrumentor
    # You can optionally pass a custom TracerProvider to instrument().
    RequestsInstrumentor().instrument()
    response = requests.get(url="https://www.example.org/")
MQTT Trace Context Propagation
I am using the paho-mqtt library as my MQTT client SDK.
While this is the most popular MQTT library for Python, I couldn’t find any auto-instrumentation libraries for it in the official contrib repo or anywhere else.
So, I decided to manually instrument it.
Propagate Context (Injection and Extraction)
One of challenges when manually instrumenting a library that sends data over the wire is to figure out where to store the trace context. I initially thought I would need to define my own envelope like below.
{
  "trace_context": {
    "traceparent":"00-0af7651916cd43dd8448eb211c80319c-b7ad6b7169203331-01",
    "tracestate":"congo=BleGNlZWRzIHRohbCBwbGVhc3VyZS4"
  },
  "payload": ""
}
Then inject the trace context on publish, extract and hydrate a new span upon receival. That would technically work but I stumbled upon this draft W3C specification for MQTT Trace Context.
According to that I have 2 options (for JSON) depending on what MQTT protocol version I want to use.
- MQTT v3 (recommendation): Use the payload of the messages and embed the trace context in the root level along with other payload data.
- MQTT v5 (specification): Use
User Propertiesto embed the trace context. User Properties is a new feature of MQTT v5.
With this information in mind, I decided to go with the latter approach of using MQTT v5 with User Properties.
Paho MQTT V5 Example
import paho.mqtt.client as mqtt
from paho.mqtt.properties import Properties
from paho.mqtt.packettypes import PacketTypes
from opentelemetry.trace.propagation.tracecontext import TraceContextTextMapPropagator

# Use the trace and metrics examples above to setup trace and metric providers here.

# Connect to mqtt v5 server and subscribe to messages as shown in http://www.steves-internet-guide.com/into-mqtt-python-client/

# Publishing with trace context
@tracer.start_as_current_span("Service2_Publish_Message", kind=SpanKind.PRODUCER)
def publish_message(payload):
    # We are injecting the current propagation context into the mqtt message as per https://w3c.github.io/trace-context-mqtt/#mqtt-v5-0-format
    carrier = {}
    propagator = TraceContextTextMapPropagator()
    propagator.inject(carrier=carrier)

    properties = Properties(PacketTypes.PUBLISH)
    properties.UserProperty = list(carrier.items())
    print("Carrier after injecting span context", properties.UserProperty)

    # publish
    client.publish("otel-demo/output2", payload, properties=properties, retain=True)

# Receiving message
def on_message(client, userdata, msg):
    payload = msg.payload.decode("utf-8")
    print(f"MQTT msg recieved: {payload}")
    counter.add(1, labels)

    # We need to extract the propagation context from user properties https://w3c.github.io/trace-context-mqtt/#trace-context-fields-placement-in-a-message
    prop = TraceContextTextMapPropagator()
    user_properties = dict(msg.properties.UserProperty)
    print("Carrier with span context", user_properties)
    ctx = prop.extract(carrier=user_properties)

    # Create a new span with context extracted from message
    with tracer.start_as_current_span("Service2_Receive_Message", context=ctx, kind=SpanKind.SERVER):
        current_span = trace.get_current_span()
        current_span.add_event("Gonna try to do something!")  # Events are are primitive logs
        # Do something here
        current_span.add_event("Processed message!")
        pass
Summary
The above code samples should now allow you to setup tracing, metrics and logging for a python app, instrument paho-mqtt library for trace context propagation and then export telemetry to a OTLP endpoint (OTEL Collector).
You can find the code samples here.
OTEL Architecture
There are 2 ways of exporting OTEL specific telemetry out of your application and getting them displayed in an observability tool like Zipkin, Jaeger, Prometheus, Azure Monitor etc.
- Export it directly to the tool of your choice using an exporter library. (See this example for ZipKin).
- Export it using the OTLP format to a OTEL Collector instance, and then configure the OTEL Collector to export the telemetry from there to the observability frontend of your choice.
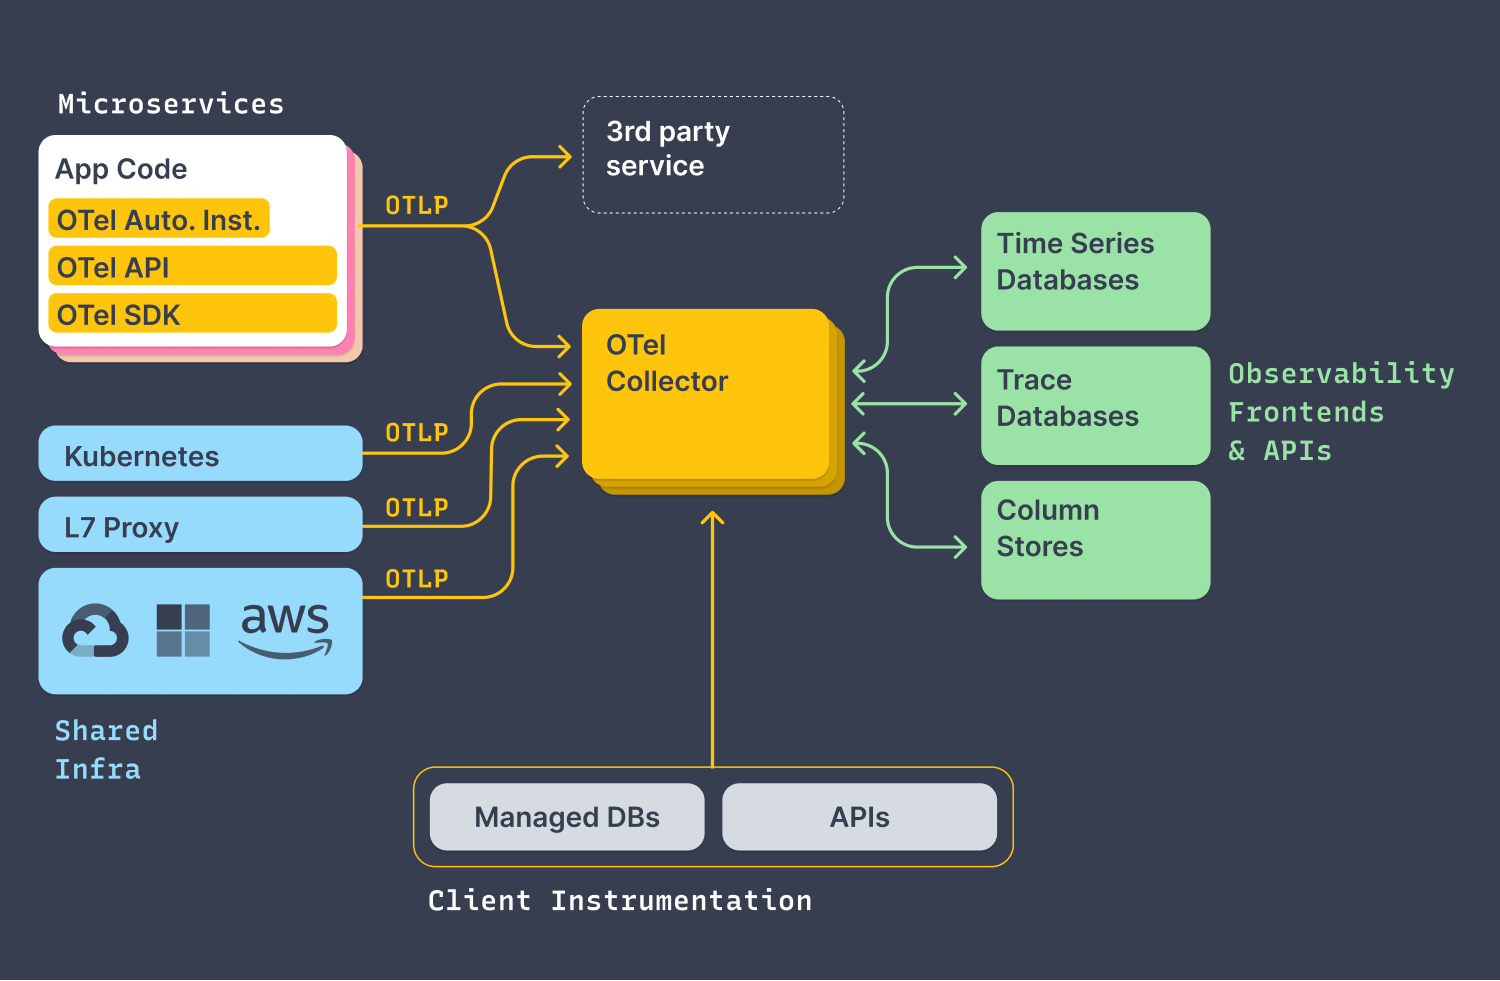
I prefer the latter option because it allows me to change my observability tools at anytime during the lifetime of the application without any code changes to the app. I only need to update the OTEL Collector configuration and redeploy the collector instance. It is much more enterprise friendly and less coupled to the app this way. Your OPS team will like this approach as it gives them control over observability without having to touch your code.
Deploying The OTEL Collector in K8s or Docker Compose
If you’re using the basic built in exporters like Zipkin and Prometheus you can use the OTEL Collector Operator for K8s.
In my case I wanted to export to Azure Monitor so I had to use the contrib variant from otel/opentelemetry-collector-contrib docker hub image.
If you want to use the contrib variant, an example with k8s manifests can be found here.
Here are the assets from my example which used docker compose.
Docker Compose File
version: "3"
volumes:
  prometheus-data: {}
  grafana-data: {}
services:
  # Jaeger
  jaeger:
    image: jaegertracing/all-in-one:latest
    ports:
      - "16686:16686"
      - "14250"

  #Zipkin
  zipkin:
    image: openzipkin/zipkin
    container_name: zipkin
    ports:
      - 9411:9411

  otel-collector:
    image: otel/opentelemetry-collector-contrib:0.50.0
    #image: otel/opentelemetry-collector
    command: ["--config=/etc/otel-collector-config.yaml"]
    volumes: # mount your config here
      - ${HOST_PROJECT_PATH}/otel-example/otel-collector-config.yaml:/etc/otel-collector-config.yaml
    ports:
      # - "1888:1888"   # pprof extension
      - "8888:8888"   # Prometheus metrics exposed by the collector
      - "8889:8889"   # Prometheus exporter metrics
      - "13133:13133" # health_check extension
      - "4317:4317"   # OTLP gRPC receiver
      - "4318:4318"   # OTLP http receiver
      # - "55679:55679" # zpages extension
    depends_on:
      - jaeger
      - zipkin

  prometheus:
    image: prom/prometheus:v2.30.3
    ports:
      - 9000:9090
    volumes: # mount your config here
      - ${HOST_PROJECT_PATH}/otel-example/prometheus:/etc/prometheus
      - prometheus-data:${HOST_PROJECT_PATH}/otel-example/prometheus
    command: --web.enable-lifecycle  --config.file=/etc/prometheus/prometheus.yml
    depends_on:
      - otel-collector

  grafana:
    image: grafana/grafana:7.5.7
    ports:
      - 3000:3000
    restart: unless-stopped
    volumes: # mount your config here
      - ${HOST_PROJECT_PATH}/otel-example/grafana:/etc/grafana/provisioning/datasources
      - grafana-data:/var/lib/grafana
    depends_on:
      - prometheus
OTEL Config
receivers:
  otlp:
    protocols:
      grpc:
  zipkin:

exporters:
  azuremonitor:
    instrumentation_key: your-app-insights-key
  jaeger:
    endpoint: jaeger:14250
    tls:
      insecure: true
  logging:
  zipkin:
    endpoint: "http://zipkin:9411/api/v2/spans"
  prometheus:
    endpoint: 0.0.0.0:8889
    const_labels:
      label1: value1
    send_timestamps: true
    metric_expiration: 180m
    resource_to_telemetry_conversion:
      enabled: true

processors:
  batch:

extensions:
  health_check:
  pprof:
  zpages:

service:
  extensions: [pprof, zpages, health_check]
  pipelines:
    traces:
      receivers: [otlp, zipkin]
      exporters: [zipkin, jaeger, logging, azuremonitor]
      processors: [batch]
    metrics:
      receivers: [otlp]
      processors: [batch]
      exporters: [logging, prometheus]
Prometheus Config
global:
  scrape_interval: 30s
  scrape_timeout: 10s

scrape_configs:
  - job_name: "otel-prometheus"
    static_configs:
    - targets: ["otel-collector:8889"]
Grafana Config
datasources:
- name: Prometheus
  access: proxy
  type: prometheus
  url: http://prometheus:9090
  isDefault: true
You can use the above manifests as a guide when deploying to k8s or docker compose and I recommend reading through the various options to understand how the OTEL Collector config and other push/pull exporters are composed together.
Bonus Reading
Have a look at how Dapr configures the OTEL Collector to capture telemetry and forwards it to a observability front end like Zipkin. Everything is setup to run in k8s.
Finishing Up
We looked at how to instrument a python app using MQTT and how to export telemetry via an OTEL Collector instance. Hopefully this serves as a starting point to help you orient yourself with the basic concepts of OTEL Signals and telemetry exporting. The code samples will be uploaded to https://github.com/dasiths/OpenTelemetryDistributedTracingSample/tree/master/python
If you have any questions please reach out to me via twitter @dasiths. Happy coding.


Leave a comment