Propagating context and tracing across your distributed process boundaries using OpenTelemetry - API Days Australia 2021
I spoke at API Days Australia about my experiences building distributed systems and some challenges I’ve faced.
We are amidst the 2nd wave of cloud migrations. This means it’s no longer enough just to have a presence on the web if you need a competitive advantage. You need to be able to thrive.
We are building more and more cloud native solutions with an emphasis on distributed systems more than any other time in the past. With cloud native distributed systems now the norm, tracing and tracking telemetry becomes a more pronounced problem for operations teams. What makes good teams stand out from the rest is how they tackle this “observability” aspect in my opinion.
This is the landscape where OpenTelemetry was born in. Telemetry data is needed to power observability products and traditionally, telemetry data has been provided by either open-source projects or commercial vendors but key the problem is lack of standardization.
OpenTelemetry was formed through a merger of the OpenTracing and OpenCensus projects which had similar motivations. The OpenTelemetry project solves these problems by providing a single, vendor-agnostic solution. The project has gained broad industry support and adoption from cloud providers, vendors and end users alike.
In this talk we will cover some of the modern challenges and some modern solutions to distributed tracing and see how all the paths lead to OpenTelemetry.
About API Days
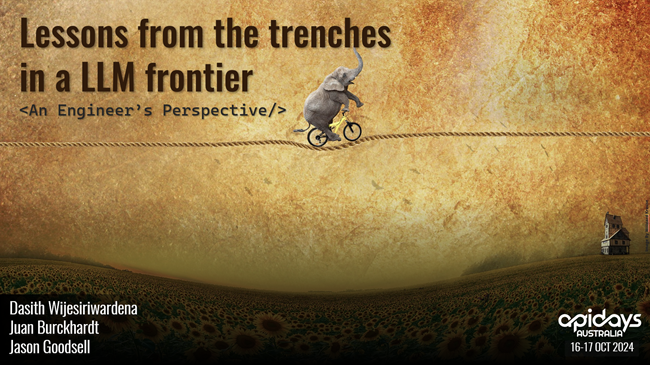
This is the fourth time I spoke at API Days and I’ve made a little niche talking about modern approaches to develop distributed system and the kind of challenges they pose. It was great to be back and talking about distributed tracing this time around.
On the API Days website it says…
It’s almost a cliché to say that the global pandemic has had profound effects on the way we do business and go about our lives. In Australia, organisations large and small have been forced to adapt to new business models and new channels as a way to survive and to provide business continuity. Others who already provided digital services were forced to expand their range and capacity to deal with higher levels of demand than previously imagined. This is the great digital acceleration of 2020-21. The digital genie is well and truly out of the bottle and in many cases we don’t want it to go back. Digital services, digital supply chains, digital ways of working – are all here to stay.
At apidays Australia, we know this from direct experience. Last year, we too were forced to reimagine our conference as a digital experience that required us to rapidly develop new platforms and new ways to engage with our audience. This year, we’re back again and still digital. Join us in September to hear stories of new technologies and new ways of doing business from your peers – both local and international.
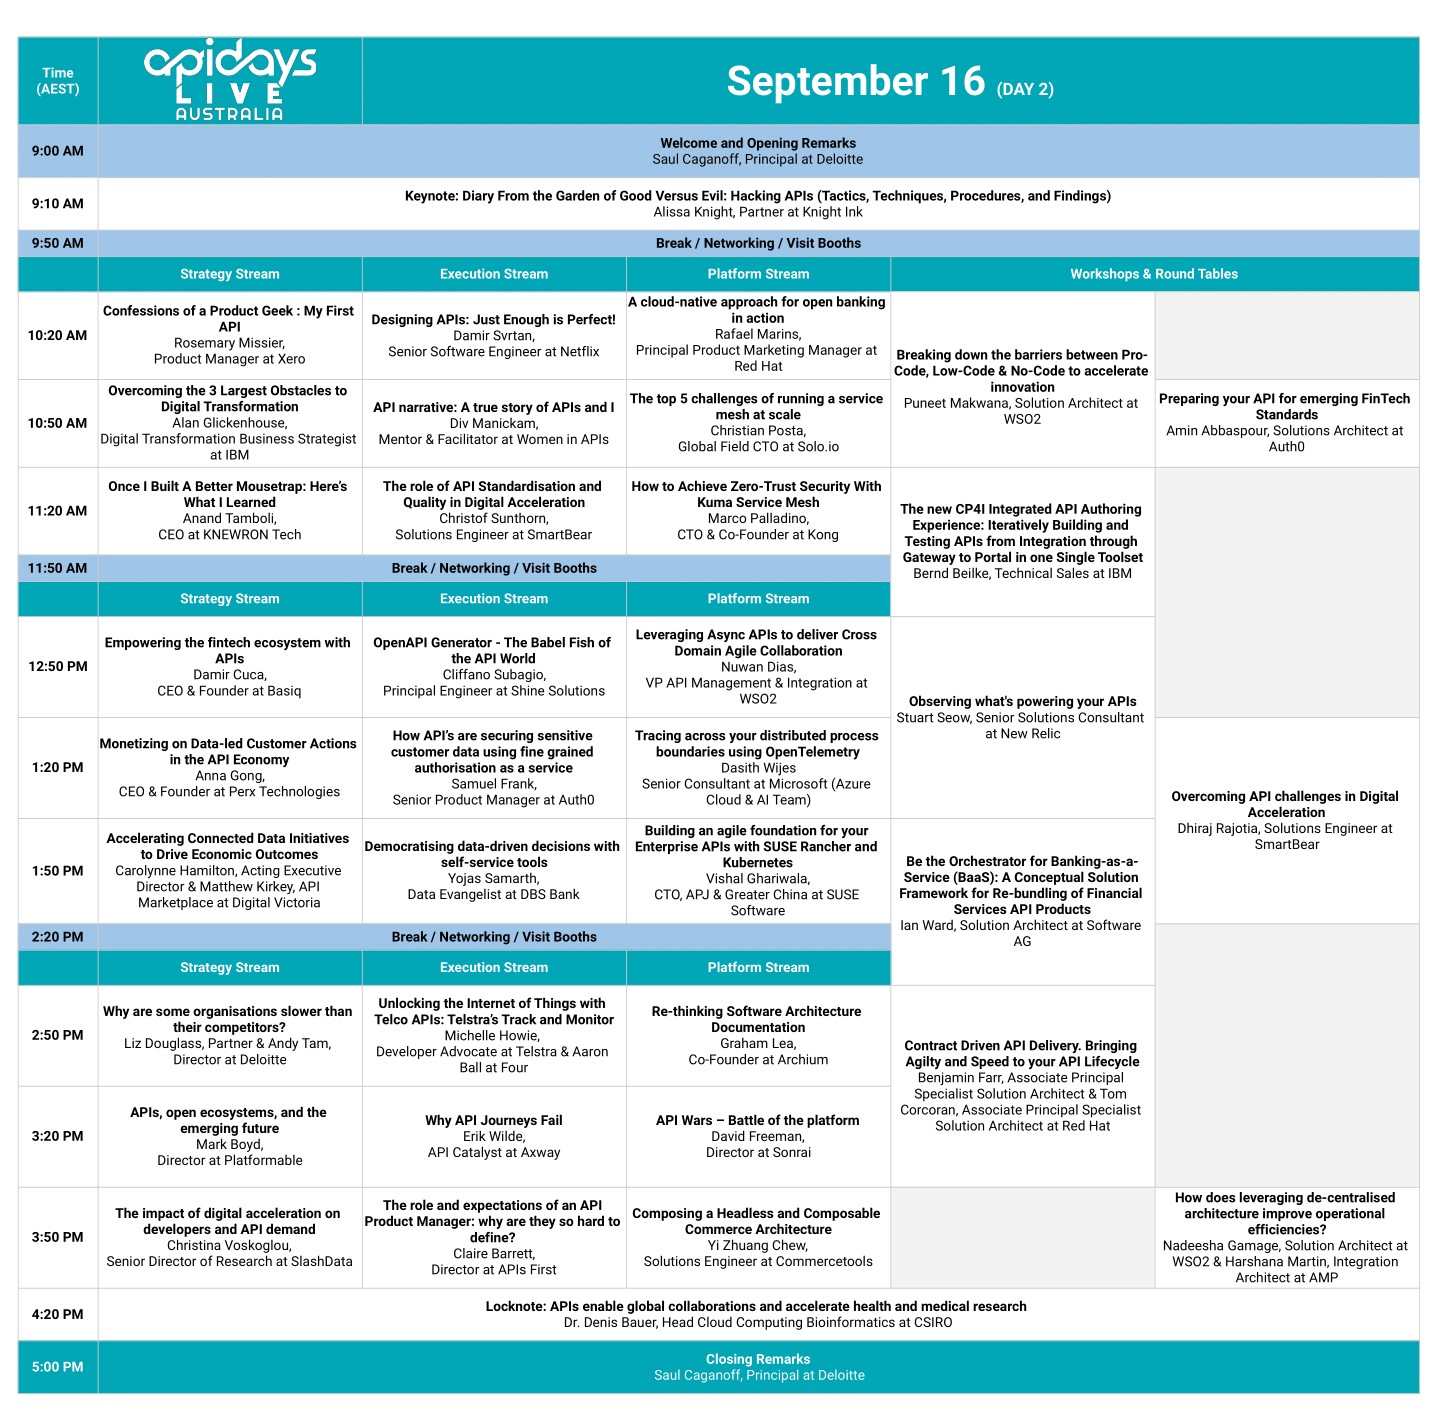
The theme this year was “Accelerating Digital” and there were multiple tracks. My session was on the “Platform” stream along with some other technical presentations from various industry experts. There were also workshops and roundtable discussions as well. You can watch full replays of talks here.

Propagating context and tracing across your distributed process boundaries using OpenTelemetry
The abstract is as follows.
Everyone is building distributed systems these days. Some better than others. One thing the teams building and running distributed systems well have in common is they have very good observability of the components and services. Conversely, the teams that don’t have good observability struggle when things go wrong in a distributed system because it’s often terribly time consuming to put the pieces together to analyse the crime scene. The logs might sit in disparate log aggregation systems and even when in one place, leave you with having to do the hard work to correlate and visualize the system workflows yourself.
OpenTelemetry is an observability framework for cloud-native software which aims to solve some of these issues by having a common set of definitions of concepts around observability and exposing them to the tool of your choice.
In this talk, I examine how to propagate your tracing context across process boundaries and visualize the flow of requests through your distributed services (Microservices/Serverless/Other) easily using tools like Zipkin and Jaeger. We will see how to use already instrumented libraries and also how to propagate the trace information yourself. At the end of this talk you will know how to easily trace and observe distributed components of the systems you build.
Recording & Slide deck
I gave an extended version of the talk at Melbourne .NET user group meetup as well. The recording can be found below.
If you have any thoughts or comments please leave them here. Thanks for taking the time to read this post.


Leave a comment